16 Vs 65: Here’s Exactly How Different Generations Prefer To Vote In Malta


A new national opinion poll has revealed major differences in voting ideologies between generations, including voting apathy, trust in the parties and their biggest concerns of Malta.
Misco conducted a national survey with 424 participants to examine the public’s opinion on the state of the island and Lovin Malta has been exclusively sent the results.
While analysing the final numbers, a pattern of disagreement emerged between younger and older generations. The biggest distinctions were found between the first five age brackets and the 65 and over category.
The first five groups are: 16 to 24, 25 to 34, 35 to 44, 45 to 54 and 55 to 64.
These differences are understandable considering older generations have distinctive experiences of what Malta is and what it used to be. Therefore their standards and opinions will evidently differ.
In general terms, the 65 and over category had its majority swaying toward the Labour Party in many of the voting-related questions.
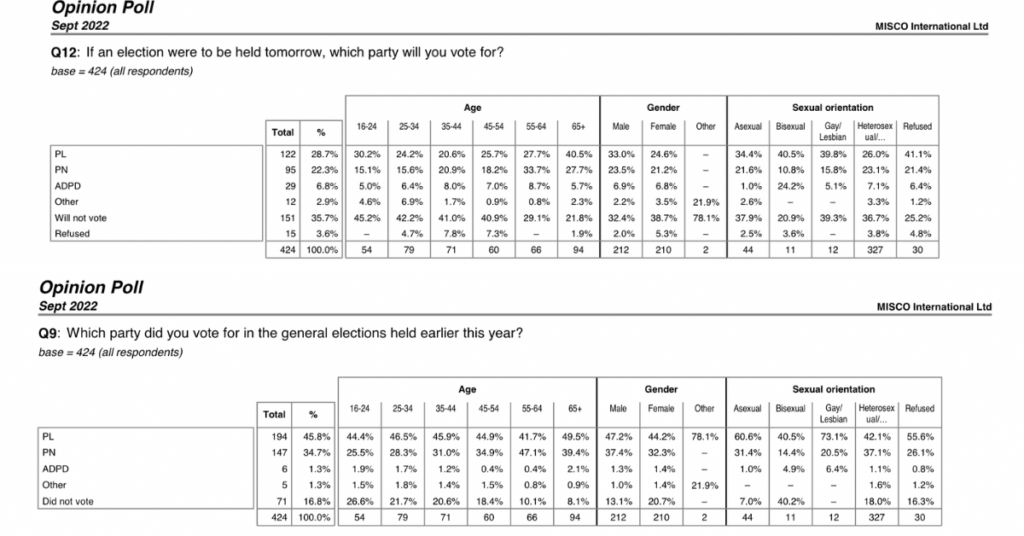
In fact, when asked which party one would vote for if an election would be held tomorrow, 40.5% of the 65 and over respondents agreed with PL while the 16 to 24 bracket had a 45.2% majority saying they would not vote at all.
When it came to voting Labour, other age ranges had their responses hovering from 20% to 30%. The main difference came with the 35 to 44 age bracket who had 20.6% vote for PL.
Meanwhile, the other age groups (ranging from 16 to 54) had all of their majorities choosing not to vote.
Alternatively, all age ranges had a majority of PL when asked who they voted for in the 2022 general elections. The generational difference comes in with the numbers of those who did not vote and will not vote if an election was held tomorrow.
However, both age ranges experienced a similar rise in voting apathy.
Within the youngest age bracket, 26.6% decided not to vote last year. When asked whether or not they would vote next year, the number to abstain doubled.
On the other hand, only 8.1% of the oldest age group did not vote last year and 21.8% said they wouldn’t vote in an election tomorrow.
This means that people choosing to abstain from voting if an election were to be held tomorrow in comparison with people who voted this year has doubled.
This further implies a drastic increase of voter apathy in both age groups.
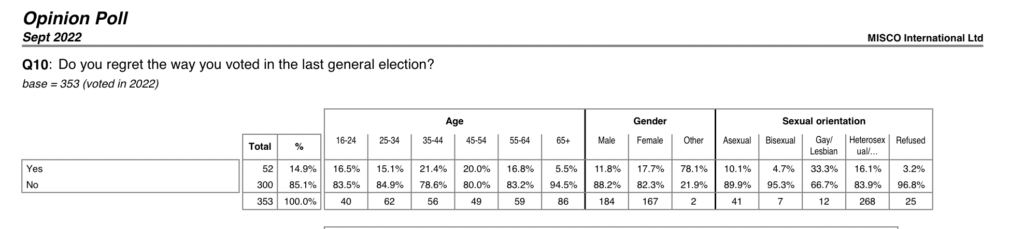
When asked whether or not voters regretted their choice in the 2022 election, respondents from the first five age groups had 16.5%, 15.1%, 21.4%, 20.0% and 16.8% regretting their choice.
In stark contrast, only 5.5% of the eldest age group admitted to regretting their choice.
The majority of different age groups mainly agree with traffic and cost living as the highest two concerns for Malta, the difference being that those 65 and over put cost of living above traffic.
Nonetheless, this isn’t the main distinction.
The difference comes in when considering which age groups trust Malta’s political parties to effectively deal with the issues. The options of this question were PL, PN, ADPD or none of them.
Within the age brackets ranging from 16 to 64, all had majorities voting for none of the political parties. The highest number is the 66.1% majority within the 25 to 34 age bracket.
Contrastingly, only 22.2% of the 65 and over group said that none of the parties could deal with these issues. The majority of this bracket lies in the PL option with 47.1%.
Similar numbers emerged when observing the respondents’ trust in political parties to deal with major personal issues.
70.2% of 16 to 24 year olds don’t believe that any political party can handle these problems while 43.4% of those 65 and above believe that the PL would deal with them best.

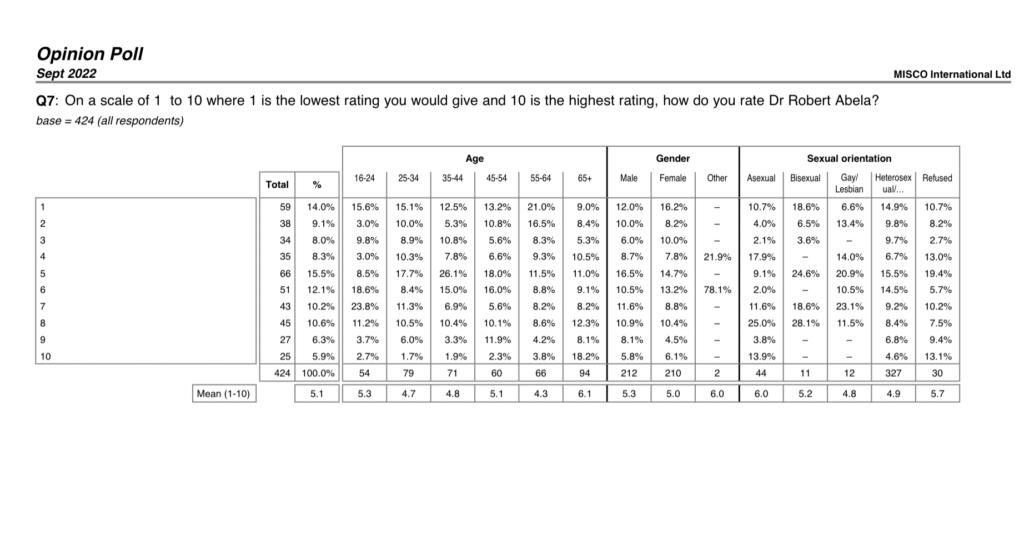
When it came to ranking politicians, opposition leader Bernard Grech got a universally low rating from all ages while Prime Minister Robert Abela got mixed reviews.
According to the survey, respondents over 65 had ranked Abela significantly higher than the other age groups.
Up until the eldest age group, those giving Abela a 10 (the highest rating) varied from 1.7% to 3.8% of respondents. Alternately, the 65+ age group had a whopping 18.2% rate him a 10.
This survey was conducted among a random sample of 457 respondents between the 9th March and 11th March. Interviews were conducted on the telephone by trained interviewers under the direct supervision of MISCO coordinators. Respondents were selected using the random digit dialling method.
A total of 574 persons were contacted to achieve a sample of 457 respondents. A sample of 457 provides a margin of error within ±4.7%. However when one applies the weighting efficiency resulting from the weighting of the data by age, gender and region, the margin of error increases to ±5.4%. The weighting efficiency is the amount of skewing that had to be done to align the sample to the actual population data.
What do you make of these numbers?