Guest Post: Sea Starts Warming With A Change… Research At MCAST Reveals

The sea took much longer to the seasonal warming this year compared to July standards in recent years.
Professor Aldo Drago at the Institute of Engineering and Transport in MCAST monitors sea surface temperature (SST) by using routine satellite observations combined to numerical models to make daily assessments on marine heat wave occurrence in the sea around the Maltese Islands.
A marine heat wave (MHW) is defined as a period during which the sea temperature is abnormally warm for the time of the year relative to historical temperatures, with that extreme warmth persisting for at least five consecutive days.
Until 9th July, the night SST was still below the climatological mean (the average sea temperature on the basis of the last 30 years of data). Subsequently, the sea temperature soared quickly up by 3°C (24°C to 27°C) in just three days.
Until Monday 15th July it reached the 28°C mark, and is set to continue to increase in the coming days.
All this heat entering the sea is coming from the sun’s thermal energy, involving phenomenal flows of energy. If we just consider a strip of water 20 km wide all around the Maltese Islands, it would require around 200 billion kWhours of energy to heat the top 10m by 4°C, this being the equivalent of the local electricity production for ten years for every 1/2 a degree rise in temperature.
This has led to the onset of the first marine heat wave experienced this Summer. The difference this year is that these events can be viewed, followed, and understood by citizens on a prototype, beta-version mobile and web app which can be accessed through a free account from here.
This is a tool developed in the STREAM project, led by MCAST in partnership with MST AudioVisual Ltd and THINK Design Ltd, and funded by the Space Research Fund of Xjenza Malta (ex MCST).
The project delivers specialised analysis of satellite data in the form of operational maps describing the intensity and duration of abnormal sea temperatures.
It allows users to follow SST anomalies and marine heat waves on a pixel-by-pixel basis, allowing data to be viewed and downloaded at any personalised location or area of interest. Just follow the user-friendly help instructions on the mobile app, and enjoy this new data service experience.
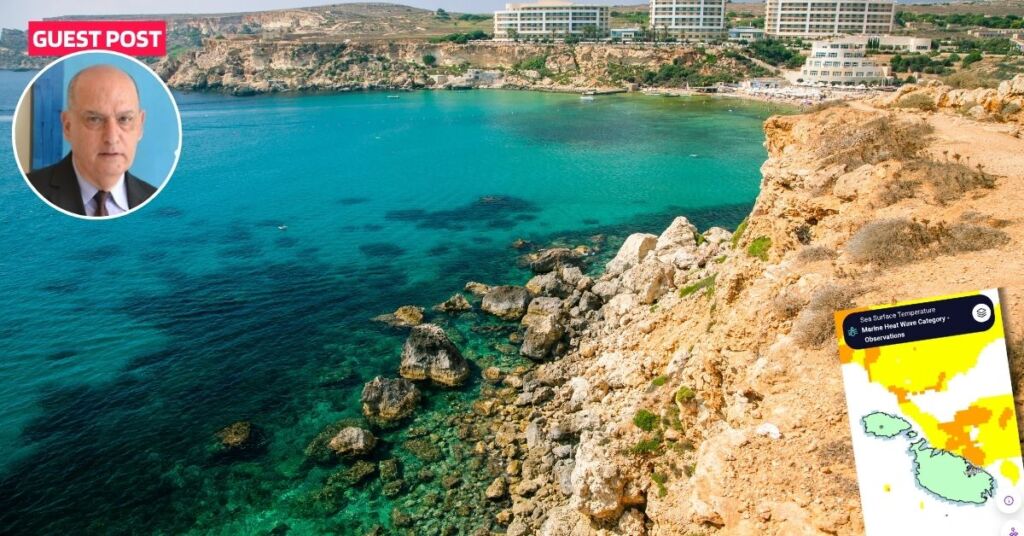
The picture is a screenshot from the app for 15th July with a zoom on the Maltese Islands. The map shows the spatial occurrence and intensity of the very first marine heat wave this year. White refers to areas with no heat waves.
The various colour shades refer to the heat wave intensity that is related to the size of the SST anomaly from the climatological mean: yellow = moderate; orange = strong; red = severe; brown = extreme.
The service further provides a forecast on how the marine SST and sea heat wave are expected to evolve in the coming days.
Users can also view the different sea temperatures of the day at any location of interest both for the Maltese Islands and a good stretch of the southern Sicilian coast.
The information can be downloaded in easy EXCEL files, with backdating to the 1st January 2023, the date to which this service is being provided in hindcast mode.
Bringing data to the citizen, and keeping you informed. The next version of the service will evolve with more functionalities in the coming months, including on-demand, personalised alert notifications, and offering a platform for a wider range of data layers in the next development stages.
If you like this service, please leave a message on the STREAM FB page.
Lovin Malta is open to interesting, compelling guest posts from third parties. These opinion pieces do not necessarily reflect the views of the company. Submit your piece at [email protected]